Home
Log masukDaftar
Sedia melabur?
Daftar sekarang

The Aroon Indicator: Tracking the Life Cycle of a Trend

Every market move has a rhythm — a beginning, a build-up, and eventually, a slowdown. The Aroon Indicator helps traders understand exactly where a trend stands in that cycle. By measuring how recently price has made its highs or lows, Aroon shows when a trend is gaining momentum or losing steam — often before the chart makes it obvious.

  1. What the Aroon indicator measures
  2. How to read the data
  3. How traders use the Aroon indicator
  4. Strengths and limitations of the Aroon indicator

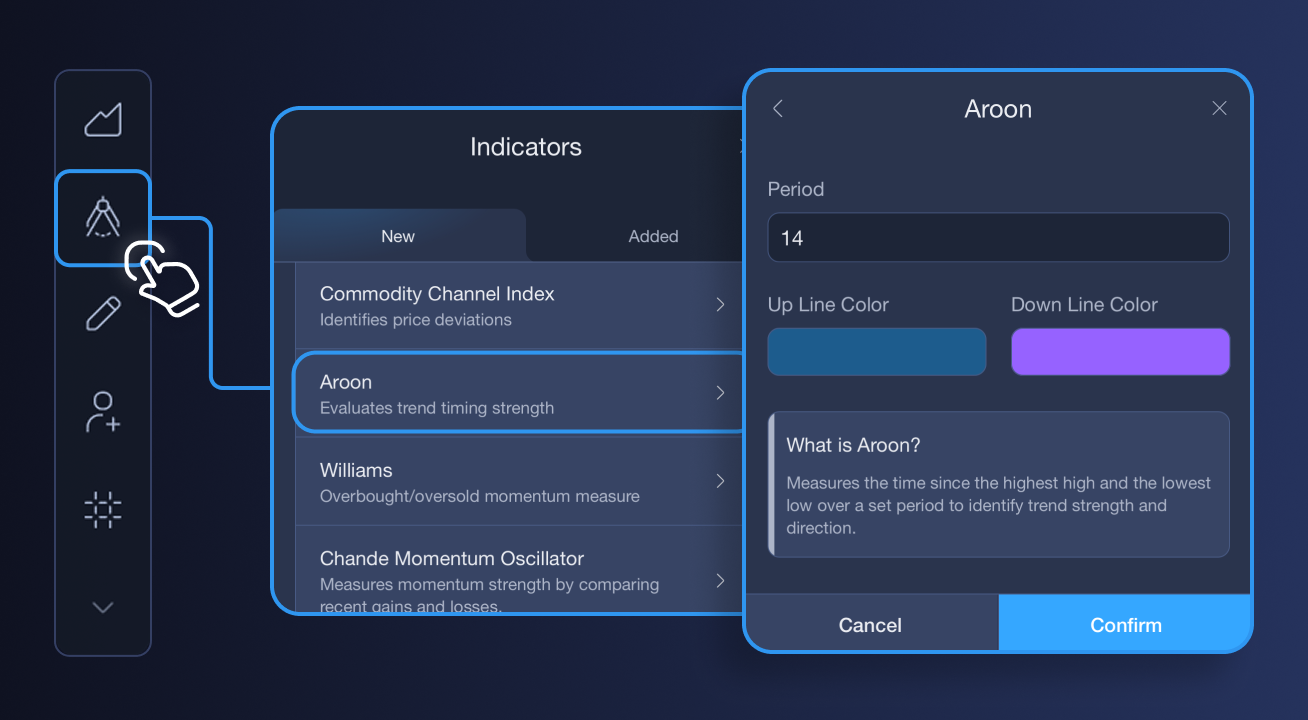
Aroon@2x

What the Aroon indicator measures

The Aroon is made up of two lines that move between 0 and 100:

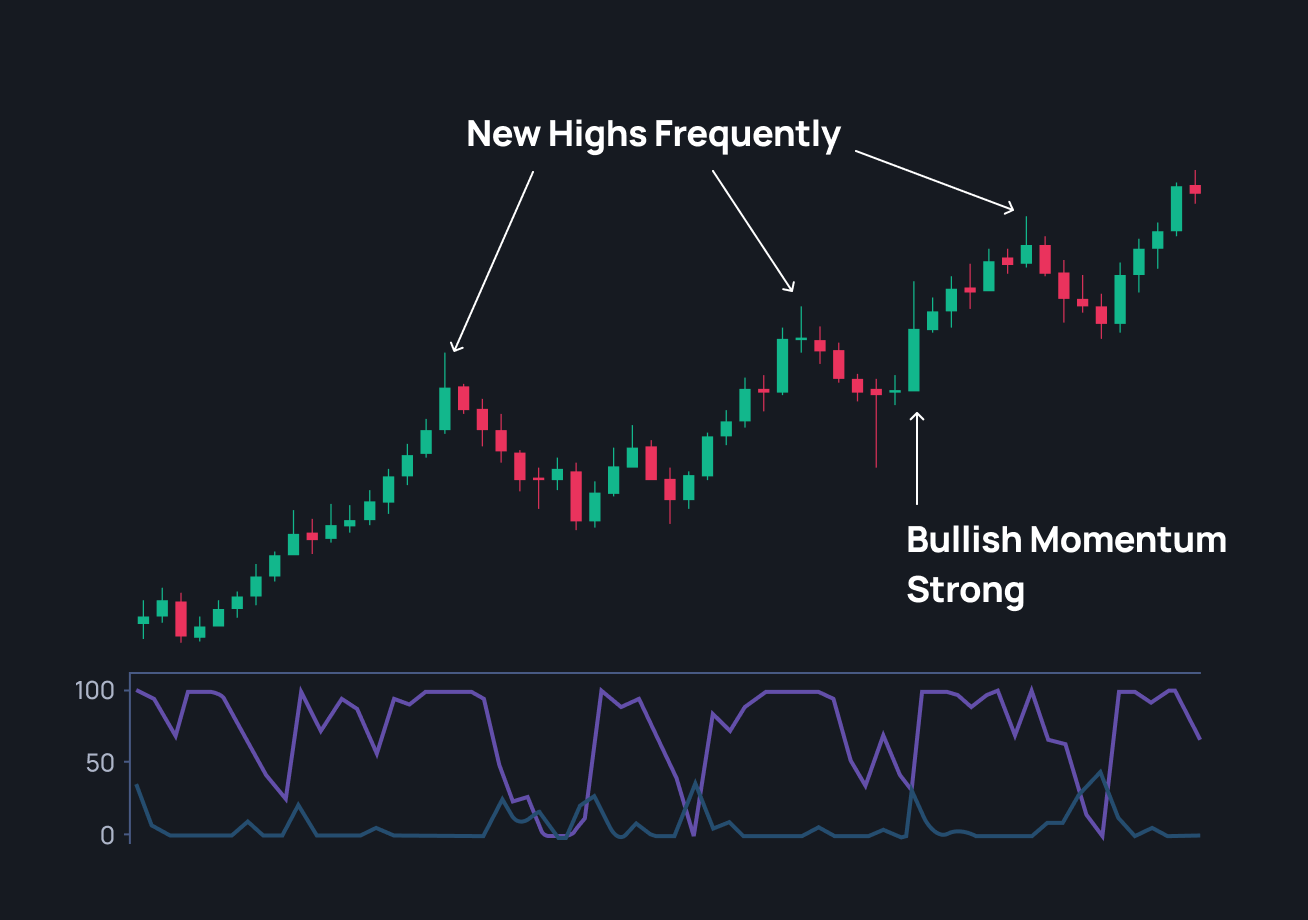
  • Aroon Up: Tracks how long it’s been since the most recent high.
  • Aroon Down: Tracks how long it’s been since the most recent low.

When the Aroon Up line stays near 100, the market is frequently setting new highs — a sign of strong bullish momentum. When Aroon Down holds near 100, the opposite is true — bears are in control.

The relationship between these two lines reveals whether a market is trending, losing strength, or consolidating.

How to read the data

Understanding the interaction between the Aroon Up and Aroon Down lines is key:

  • Strong uptrend: Aroon Up near 100, Aroon Down near 0.
  • Strong downtrend: Aroon Down near 100, Aroon Up near 0.
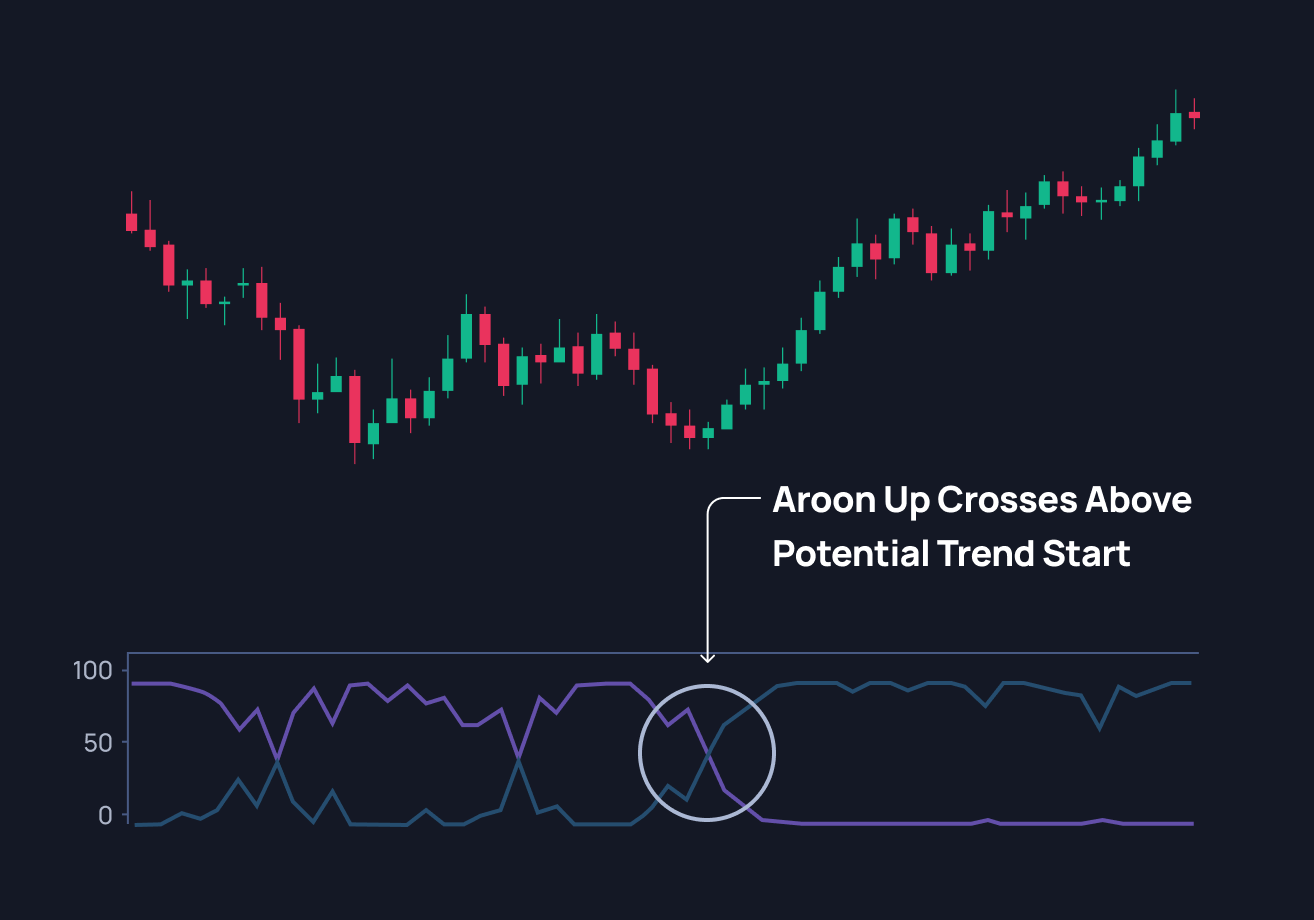
  • Crossover: When Aroon Up crosses above Aroon Down, it often suggests a new bullish phase. The reverse crossover can indicate a bearish shift.
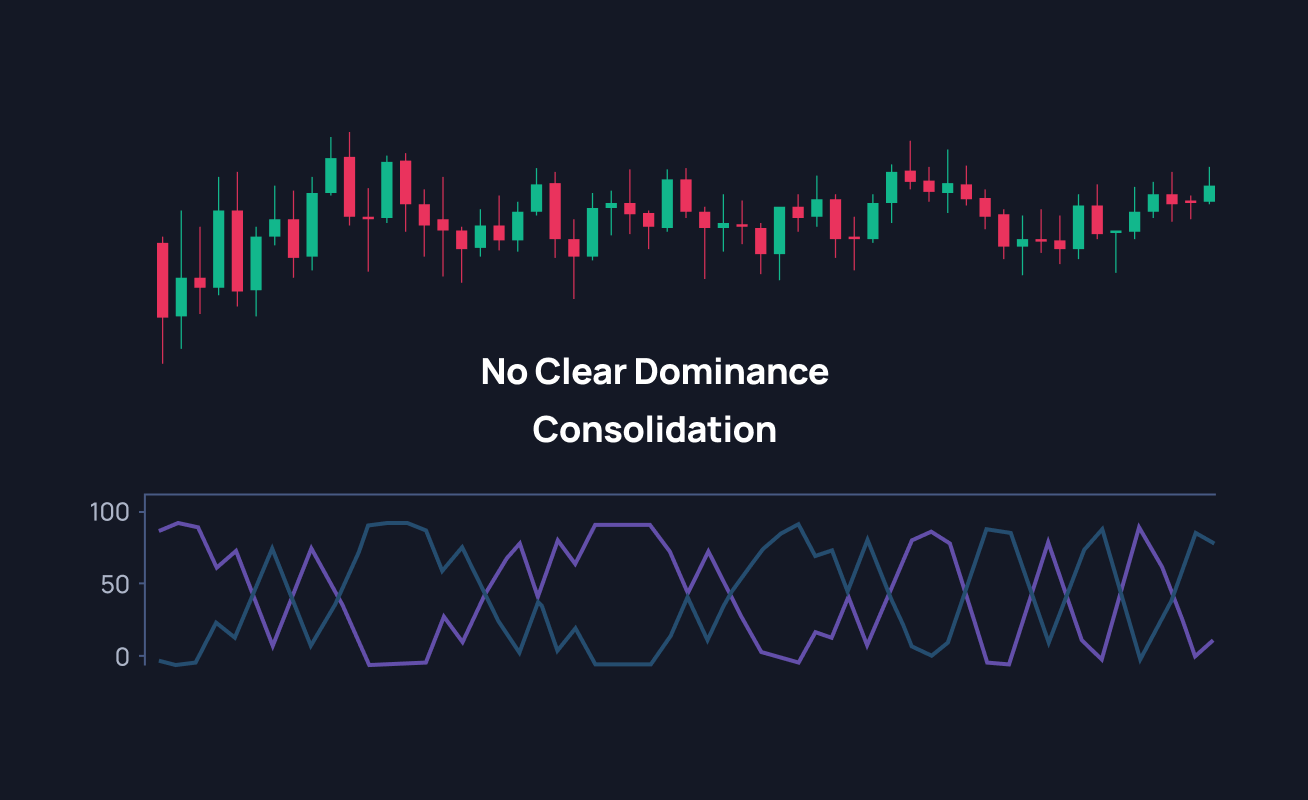
  • Both near 50: Indicates the market is moving sideways or lacking a clear direction.

Unlike many indicators that react to price changes, the Aroon focuses on time — how recently the market reached new highs or lows — making it a unique way to read trend strength.

Aroon@2x 1

How traders use the Aroon indicator

1. Spotting new trends
When Aroon Up crosses above Aroon Down and stays high, it indicates that bulls are consistently pushing prices higher. Traders often look for this setup to identify the early stages of a bullish trend.

2. Recognizing trend fatigue
If both lines begin to drift toward the middle of the range (around 50), it can indicate that a trend is losing momentum and the market may start consolidating.

3. Confirming reversals
After a long uptrend, if Aroon Down crosses above Aroon Up and remains elevated, it’s an early warning that the market could be shifting direction.

Aroon@2x 3

Strengths and limitations of the Aroon indicator

One of the reasons traders like the Aroon Indicator is its clarity. It offers a straightforward visual of how strong or weak a trend is, without requiring complex interpretation. When used correctly, it helps traders stay aligned with the dominant direction and avoid entering when momentum is fading.

  • Provides early insight into changes in trend strength.
  • Offers a clear, visual picture of whether momentum is building or fading.
  • Works well across different timeframes, making it useful for both short-term and swing traders.

That said, the Aroon Indicator is powerful but not perfect:

  • It can generate false data in choppy or sideways markets.
  • It may lag slightly after sharp reversals or large price spikes.

Aroon@2x 2

It performs best when used with other confirmation tools, such as:

  • Moving Averages: Help confirm the broader trend direction.
  • ADX (Average Directional Index): Measures the strength of the trend to filter weak cues.
  • RSI (Relative Strength Index): Identifies overbought or oversold conditions, adding a momentum perspective.

Combining these tools can help confirm whether an Aroon reflects genuine market strength or just temporary noise.

The Aroon Indicator gives traders a clear way to see how strong a trend really is — not just where it’s going, but how much energy it still has. By tracking the timing of highs and lows, Aroon helps identify when momentum is building, when it’s fading, and when it might be about to reverse.

Add it to your trading toolbox as a trend health check. Used with other confirmation tools, the Aroon can help you enter earlier, exit smarter, and trade more confidently in tune with the market’s rhythm.

Sedia melabur?
Daftar sekarang
ExpertOption

Syarikat tidak menyediakan perkhidmatan kepada rakyat dan/atau penduduk Australia, Austria, Belarus, Belgium, Bulgaria, Kanada, Croatia, Republik Cyprus, Republik Czech, Denmark, Estonia, Finland, Perancis, Jerman, Greece, Hungary, Iceland, Iran, Ireland, Israel, Itali, Latvia, Liechtenstein, Lithuania, Luxembourg, Malta, Myanmar, Belanda, New Zealand, Korea Utara, Norway, Poland, Portugal, Puerto Rico, Romania, Rusia, Singapura, Slovakia, Slovenia, Sudan Selatan, Sepanyol, Sudan, Sweden, Switzerland, UK, Ukraine, Amerika Syarikat, Yaman.

Pedagang
Program affiliate
Partners ExpertOption

Kaedah pembayaran

Payment and Withdrawal methods ExpertOption
Perdagangan dan pelaburan melibatkan tahap risiko yang tinggi dan mungkin tidak sesuai untuk semua pelanggan. Sila pastikan anda mempertimbangkan secara teliti objektif pelaburan anda, tahap pengalaman dan kesanggupan ambil risiko sebelum berurusan di laman web. Aktiviti perdagangan boleh mengakibatkan kerugian sebahagian atau keseluruhan dana anda, oleh itu, anda tidak sepatutnya melaburkan dana yang anda tidak mampu untuk hilang. Fahami sepenuhnya semua risiko perdagangan dan pelaburan dan dapatkan nasihat daripada penasihat kewangan bebas jika mempunyai sebarang keraguan. Anda diberi hak terhad tidak eksklusif untuk menggunakan IP yang terkandung di laman web untuk kegunaan peribadi bukan komersial serta tidak boleh dipindah milik dan hanya berkaitan dengan perkhidmatan yang ditawarkan di laman web.
Memandangkan EOLabs LLC bukan dalam pengawasan JFSA, ia tidak terlibat dalam sebarang tindakan yang dianggap sebagai menawarkan produk kewangan dan permohonan untuk perkhidmatan kewangan kepada Jepun, dan laman web ini tidak ditujukan kepada penduduk di Jepun.
© 2014–2026 ExpertOption
ExpertOption. Hak cipta terpelihara.